
The US economy is terrible. Why? In poll after poll, people seem to think or, more accurately, to feel that the US economy is terrible.,
Why do people tell pollsters this? First, let’s look at the data and then understand the reason polls keep reporting that people don’t “feel” economic improvements they’ve experienced.
First of all, the data tells us that the US economy is doing well, and has been, since the Covid pandemic and its economic recession ended, and economic recovery began:
Unemployment: Unemployment has been at 4% or below since February 2022. That is more than 2 years of unemployment at an all-time low level.
Wage Growth: For the 12 months ended in March and December ’23 and March ’24, wages have increased for all workers 5% (March ’23), 4.3% (Dec. ’23) and 4.4% (March ’24). This means that wage increases have kept up with or exceeded the inflation rate during the same time period.
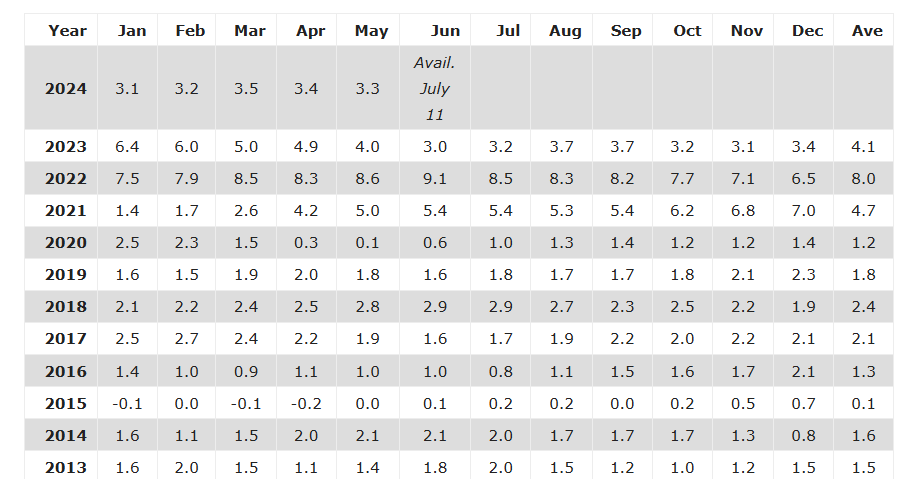
Inflation: Since May 2023, the month-over-month inflation rate has been below 4%.
- For all of 2022 the average inflation rate was 8%, because of the price surges that followed the global recession caused by the Covid pandemic. The pandemic-triggered recession depressed inflation rates from 2020 to 2021 from .1% (yes, .1%, not 1% in May 2020) to 1.7% in Feb. 2022.
- Those people who yearn for the days of low inflation during the pandemic would do well to remember that although inflation was below 2% between April 2020 and February 2022, the unemployment rate ranged between 14.8% and 4.1%.
- People may have enjoyed relatively cheap prices and low inflation (characteristics of an economy in recession), but even those who were employed during that time should remember that many millions more people were unemployed than is desirable or normal.
lnflation data
Despite all this encouraging and positive economic data, polls continue to tell us that people don’t “feel” that the economy is doing well. They insist, according to pollsters, that the U.S. economy is terrible.
Why?
Consider an example of someone I know. Let’s call him John. In June of 2024, John’s earning more than he ever has before. He changed jobs during the 2020-2024 period and increased his income significantly. In 2024, John is now earning about 60% than he was in 2019.Inflation Data 2013-2024.
John — an example
John has always had a 401K through his employer and an IRA retirement account. In 2024, John started putting more into his 401K, and by December, he will have put the annual maximum into his 401K. John has very good job security and does not consider himself at risk of layoff or losing his job for another reason.
Since changing jobs a few years ago, he also has better fringe benefits, and the cost of health insurance for himself and his family is lower than it was before 2022.
In many ways, John is not unusual. According to Pew Research, since 2020, the number of people who changed jobs increased — in part due to the Covid pandemic. From April 2021 to March 2022, quit rates (the rate at which people leave jobs) reached post-pandemic highs. The majority of workers switching jobs (60%) saw an increase in their real earnings over the same month the previous year.
If John considers his own situation, there are no serious economic negatives. In fact, he’s doing very well by any definition. And all the people in John’s coworker group or circle of friends are doing well. Although some are doing better and others are not as well off as he is, everyone is employed and able to meet their needs and wants.
Well, everyone he knows is employed except for two of his friends in their early sixties who retired recently — one in late 2023 and another earlier this year — because they have done well enough in the last few years that their retirement nest eggs reached levels that enabled them to “pull the trigger” on retirement and stop working without anxiety about their economic futures.
When a pollster calls — the U. S. economy is terrible
So, if John and his friends are all doing well, how does that explain the polling data that tells us the majority of Americans think the economy is “terrible?
John got a phone call from a pollster earlier in June, and when he was asked how he felt about the economy, he was given choices of “excellent, good, fair, or poor.”
John thought for a moment and remembered what he has been hearing on the news every night (John’s primary source of news is Fox News, which he has watched regularly for years).
In response to the question about how he felt about the economy, he told the pollster that the US economy is “Poor.”
When the pollster asked why he gave that answer, he said, “It’s what I hear on the news. Unemployment is going up and up every month, and the United States is in a recession. I’m doing OK but a lot of people aren’t.”
Data differs from broadcast news
Does John try to explain the difference, that he and all his friends are doing fine but Fox News tells him the economy is in “terrible” shape — with high unemployment and rising inflation?
No. He’s not an economist, and he doesn’t think there’s any reason to question what he hears on Fox News. So, when the pollster asks him for his opinion on the economy in the United States, he repeats what he hears on Fox News because he thinks it’s the most accurate answer to give.
John could know that what Fox News tells him is false — since it contradicts economic data on employment, inflation and wage growth. But he doesn’t look at the data or think about how different the Fox News reality is from the reality of his life and that of his friends and colleagues.
Month after month, ratings data shows Fox News programs, whether “news” or “opinion” programming, have ratings that far exceed other broadcast news sources. Fox News is extremely popular.
This is why polls report that Americans think the US economy is “terrible” or that they aren’t “feeling” the economic benefits of the data on unemployment, wages and inflation. They are repeating :hat Fox News tells them.
DATA SOURCES:
Unemployment: Bureau of Labor Statistics: Civilian unemployment rate (bls.gov)
Wage Change: Bureau of Labor Statistics: Table 8. Wages and salaries (not seasonally adjusted): Employment Cost Index for wages and salaries, for civilian workers, by occupational group and industry – 2024 Q01 Results (bls.gov)
Inflation: Bureau of Labor Statistics, Current US Inflation Rates: 2000-2024 (usinflationcalculator.com). The BLS data is located here: Consumer Price Index Data from 1913 to 2024 (usinflationcalculator.com)
Cable News Ratings: Cable News Ratings for May 2024